Today
- Before class: Copy
handouts/plotting exercises.ipynbto your class notes folder. - A1 and A2 talk
- Viz - discussion and practice
Peer review, assignment 1
Great averages so far: roughly 91% overall, 92% on the python exercises.
Peer review comments
- The feedback you wrote I've seen has been polite, encouraging, and helpful
- The GPT suggestions look good! Check them out - most add comments that make the code better (style) and follow best practices
Assignment 2
- The answer key I uploaded has a lot of discussion and bonus material.
- I have a "clean" version that streamlines it to just show the code that solves things
- Should we discuss the latter today or next class?
- I'd like students to share tips that helped them work through problems
Data Viz is not this...
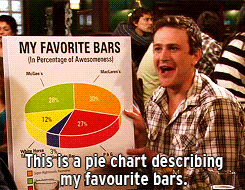
Or this
Or this
Or this
In other words
The ability to plot large datasets is both powerful and exciting
Data viz discussion
(Take notes during this period)
Important: Data viz (and analysis) is iterative: you learn what's worth looking at only as you go
Overlaps with our ABCD rule: PLOT A LOT! A LOT! A LOT!
Plot
("sns" means the "seaborn" package)
- To explore data, discover trends/comps/relationship, present results
- To find relationships that differ by groups
- To understand data issues
- B/c summary stats only
describepart of distribution- Leverage (
td_a) has a mean of 0.24 and std 0.38
- Leverage (
Reasonable things to explore via plot
Read Chapter 3.3 for much more discussion of plotting (the whys and the hows)
- Explore variation within variables (distributions)
- Explore covariation between variables
- Explore how distributions depends on groups
- Explore how covariation depends on groups
EDA hacks
- Ad-hoc, fast:
eda.py- Stats only
- Thorough, slow: ydata-profiling
- Some graphics on distributions and covariations
- Maybe: use when you get new data, and when you think you're done with cleaning / about to start analysis
- You still need to be able to use and run EDA code manually (
df.describe()) ... much faster
Plotting process
| # | Step | Note |
|---|---|---|
| 0 | Ask a question about the data | Ex: What is the distribution of unemployment in each state? |
| 1 | Q > What the plot should look like. Draw it! | Draw it on paper! |
| 2 | Plot appearance > which plot function/options to use | Find a pd or sns plot example that looks like that. |
| 3 | The function dictates how data should be formatted before you call the plot | Key: Wide or tall? |

Next class
- More practice and discussion of data viz
- Student demos (see discussion board)